One of the features I love in QlikView is cyclic dimension group. This was not present in earlier versions of Qlik Sense and then it was substituted with alternate dimensions.
Well, sort of. There are a few things which are still missing in Qlik Sense when you compare alternate dimensions to cyclic dimension groups. First, you cannot define alternate dimension as a master measure, so you need to define them for each chart individually (you can define dimension groups – cyclic or drill down – in QlikView). Second, you cannot use alternate dimensions in tables (you can in QlikView). And third, you cannot control chart measures according to which dimension of the alternative ones is currently selected, because there’s no GetCurrentField(GroupName) function (there are no “groups” which exist in QlikView). At least that’s what I thought until I found function called GetObjectField(), completely by chance while looking for something else at the help site.
So I dropped everything to try this function and see if it can work for my scenario. And – surprise, surprise – it can! But first thing first. Let’s see what the help site says:
GetObjectField([index])This function returns the name of the dimension. Index is an optional integer denoting which of the used dimensions that should be returned.
(source: https://help.qlik.com/en-US/sense/February2019/Subsystems/Hub/Content/Sense_Hub/Scripting/SystemFunctions/GetObjectField.htm)
This sounds like it does exactly what GetCurrentField() function, right? Yes! So I finally had a solution for one of my pains. A typical requirement was to show a share of a measure relative to total. A typical use case for the TOTAL qualifier in an aggregation function. This could be made dynamic in QlikView by using GetCurrentField() function, for example like this:
Sum(Patients)/Sum(TOTAL <$(=GetCurrentField([Dimensions]))> Patients)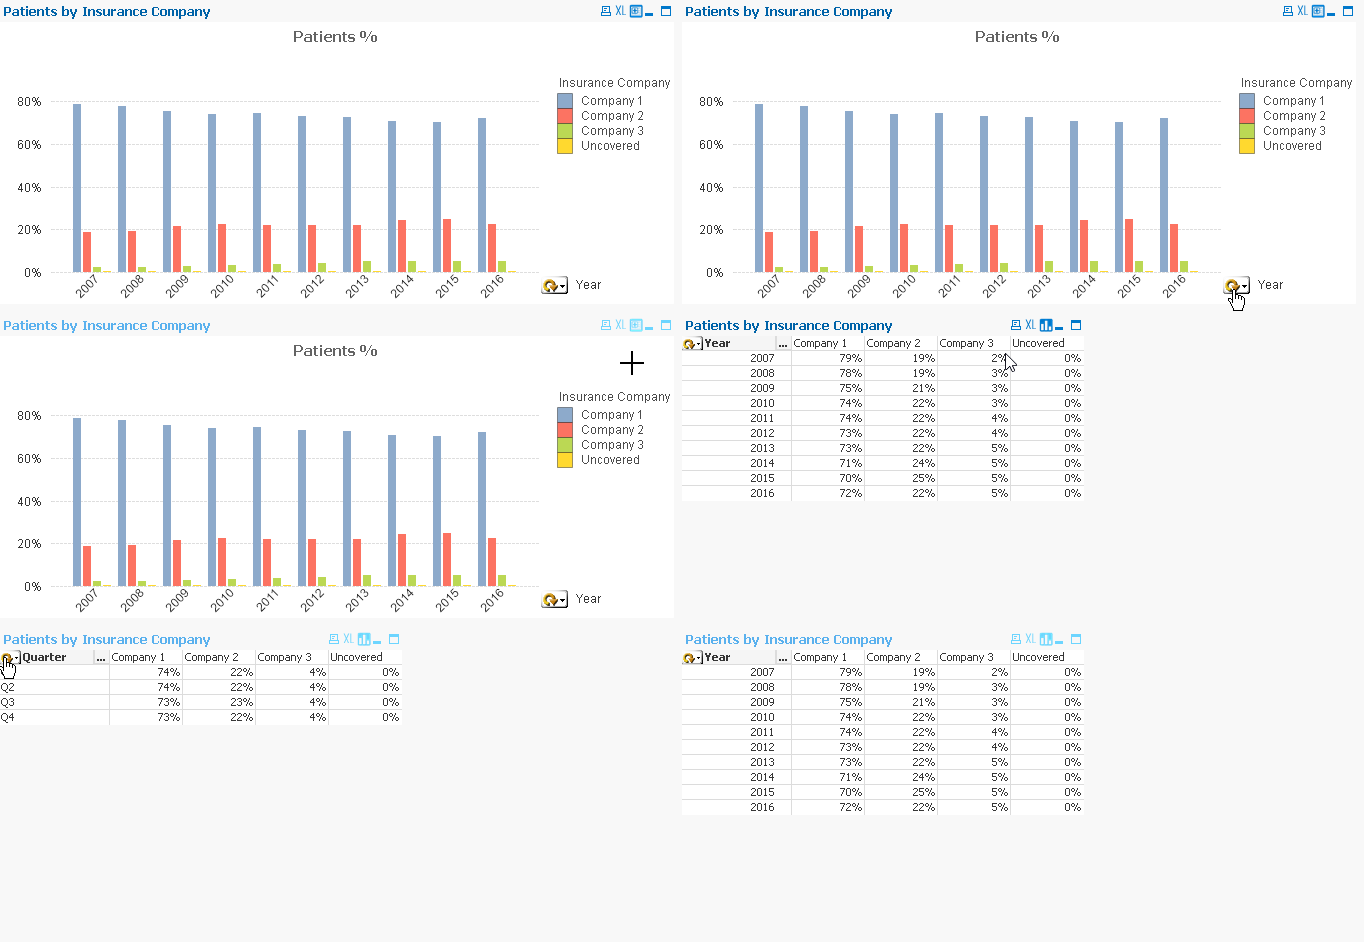
I thought this was not possible in Qlik Sense, but it is, thanks to GetObjectField(), which does exactly the same thing. So I simply added a couple of alternative dimensions to a bar chart, slightly adjusted the measure calculation, and voila:
Sum(Patients)/Sum(Total <$(=GetObjectField(0))> Patients)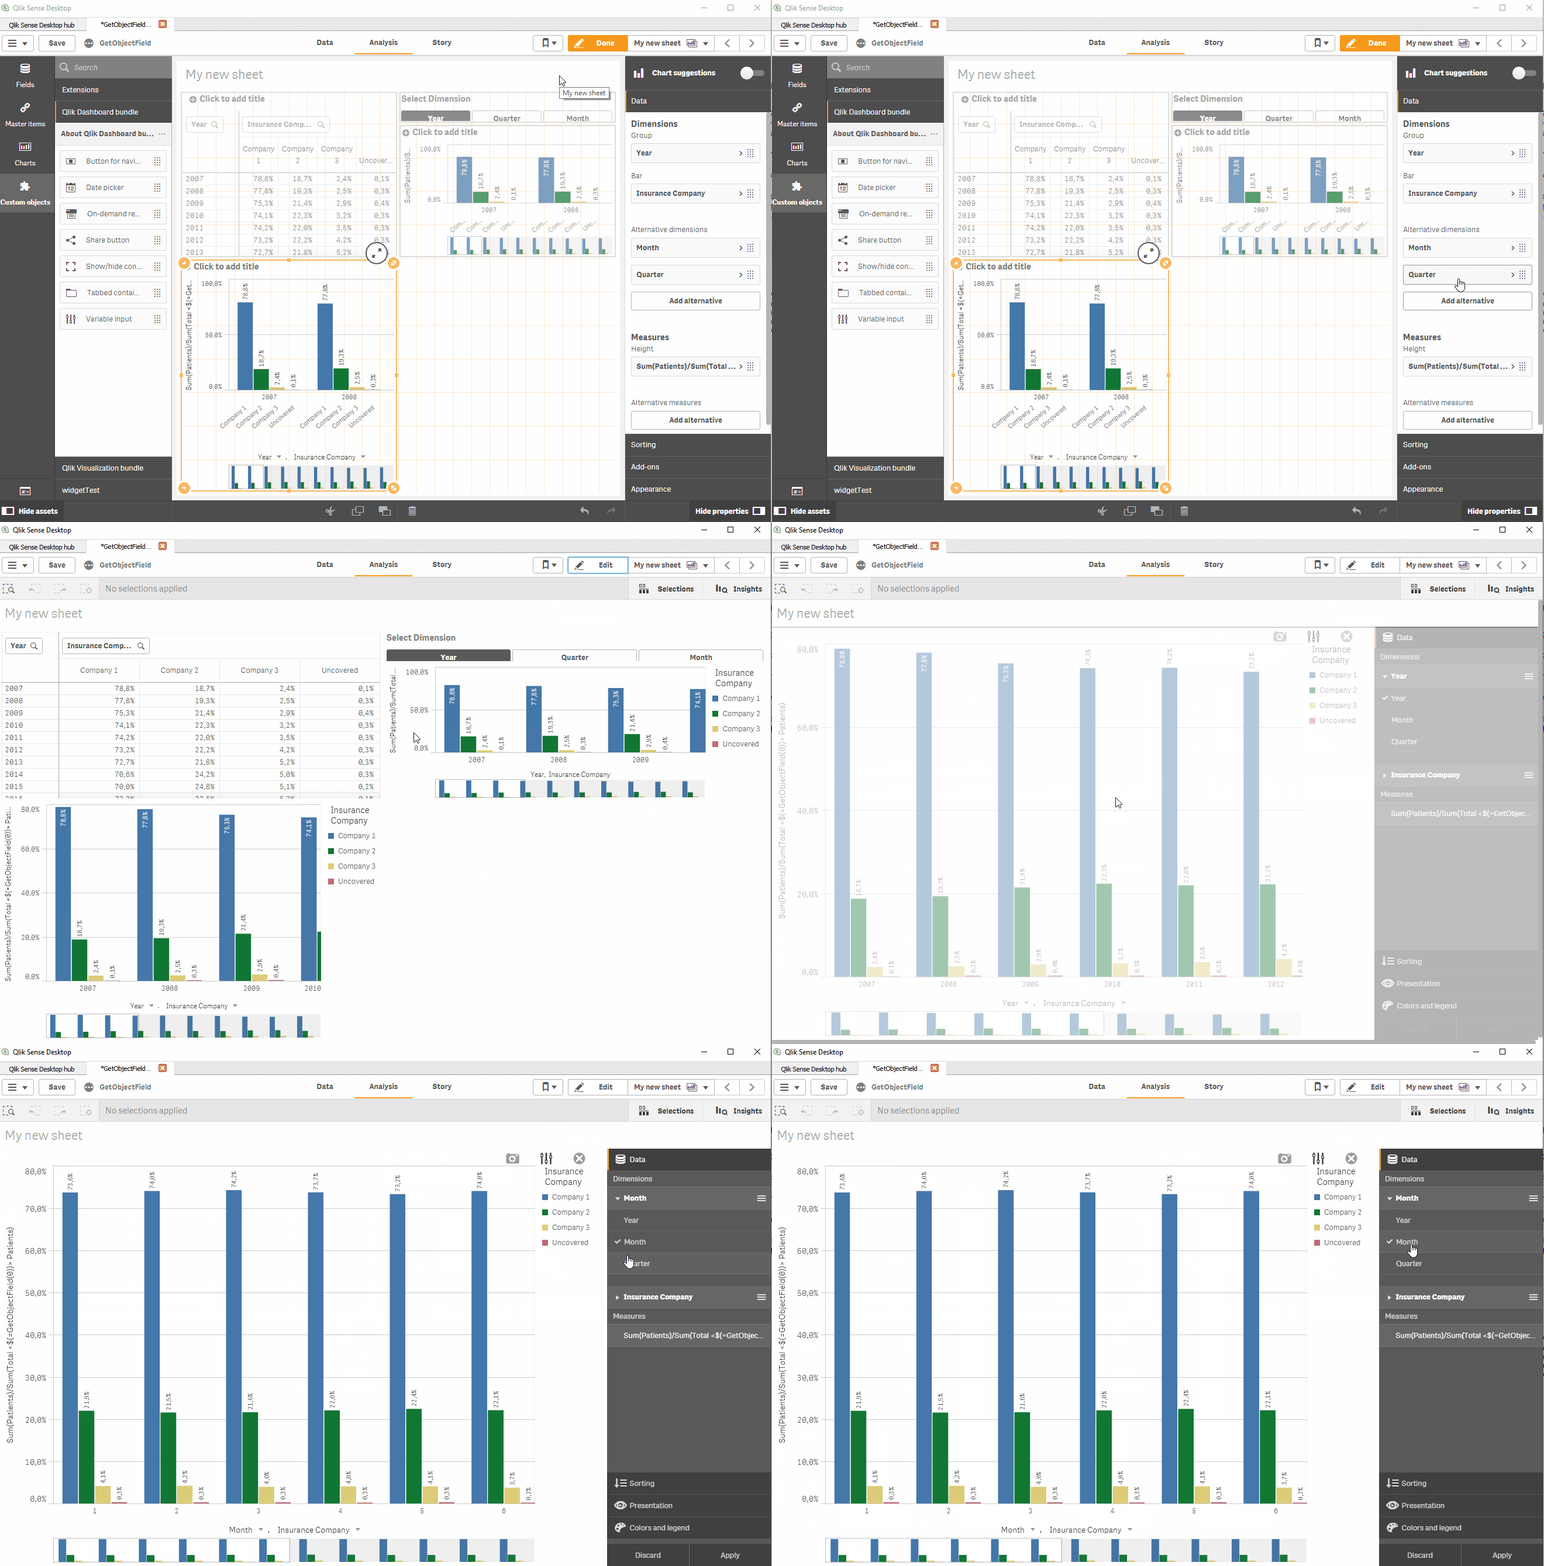
There’s one thing you need to be careful about though. In Qlik Sense, since alternative dimensions are not defined as a group, ALL chart dimensions are alternatives to each other. So whenever you want to show grouped or stacked bar chart as in my example and use alternative dimensions, users can choose wrong dimension very easily and get unexpected visualization. That’s why I also tried a different approach, with variable and buttons changing contents of that variable. I then used the variable as chart dimension getting exactly the same result with two benefits: 1) I now can have a “fixed” dimension and 2) this can be used in tables as well!
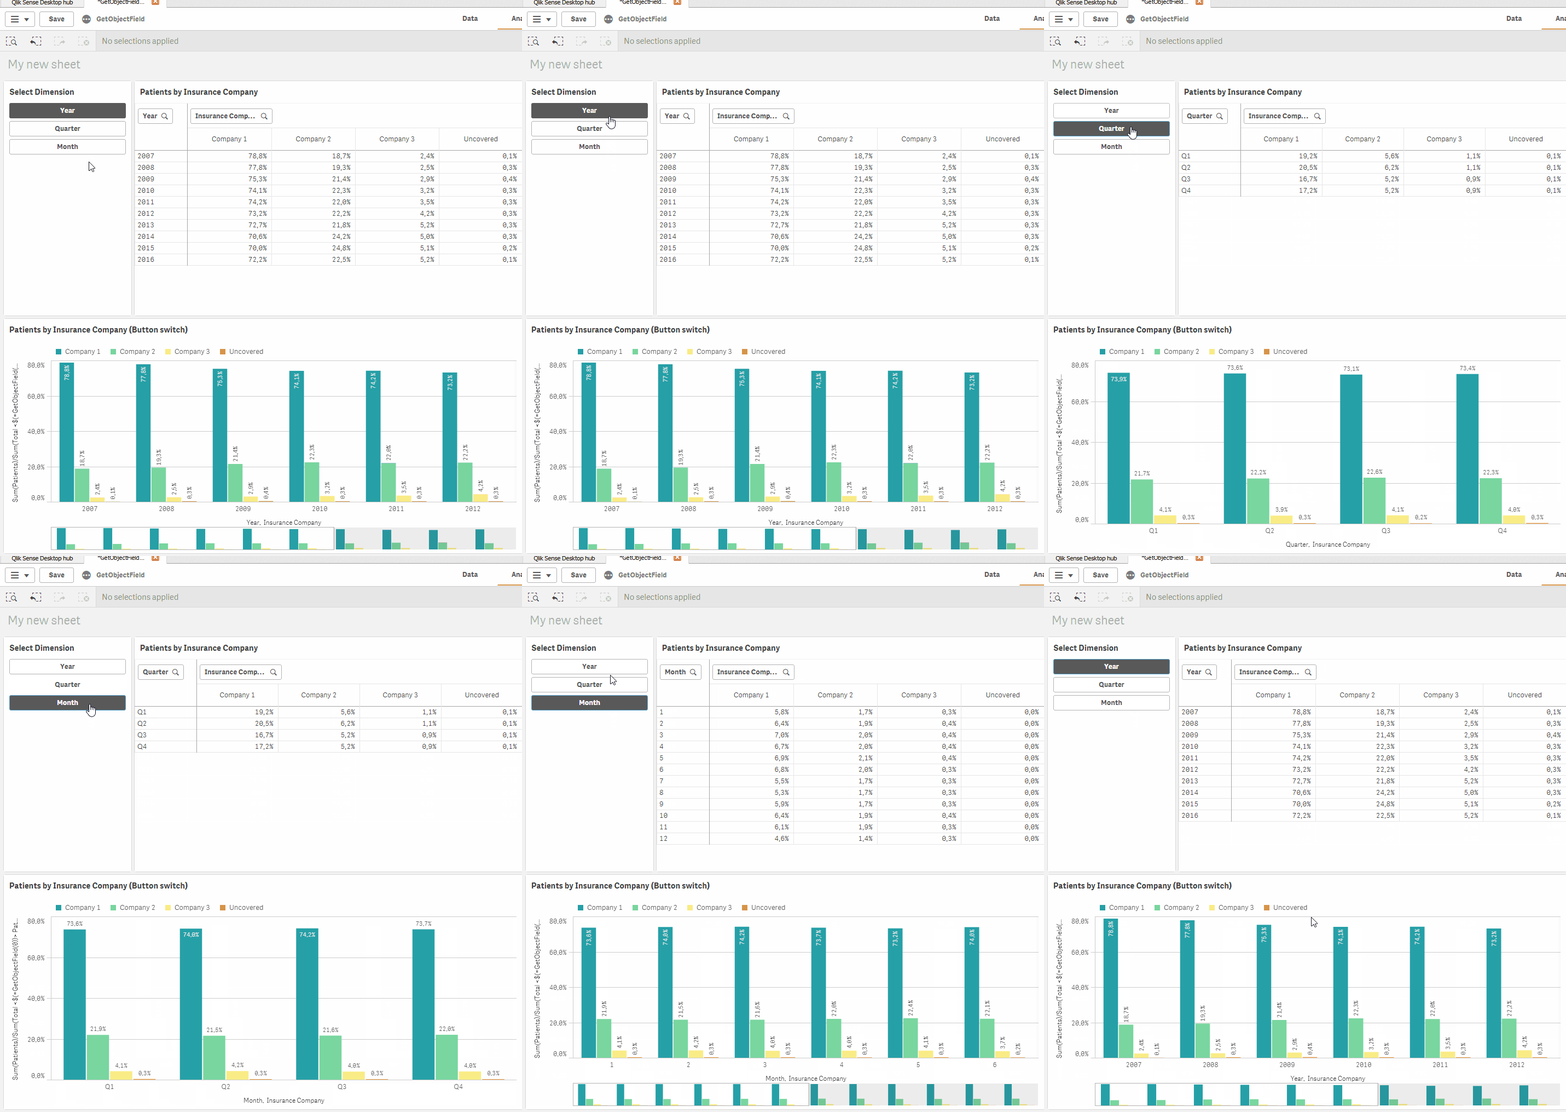
Easy, right? I also created a sample app to record these animations which you can download in case I did not explain everything clearly. Enjoy!

7 thoughts on “GetObjectField() function and Alternate Dimensions”
Nice post about GetObjectField(), one of those seldom used functions I’m always wondering where I would use it! There are a couple of interesting features of TOTAL that apply here. You could specify your TOTAL in this case as:
Total
TOTAL, unlike Aggr() uses only the dimensions found in the current chart.
In QlikView, you can specify the groupname in Total:
Total
The expression syntax checker flags it as an error, but it is valid and will give the same result as GetCurrentField().
Your comment editor ate my angle brackets. The Qlik Sense example should be:
Total < Month, Quarter, Year >
The QlikView example should be:
Total < myGroup >
Hi Rob,
thanks for stoping by. I wasn’t aware of these facts, my life would’ve been somewhat easier. I remember trying to use group name in QlikView, but I ran into some problem, so I used GetCurrentField() instead. Perhaps I was doing something wrong.
For those interested, here are links to help page describing Rob’s examples:
Qlik Sense: https://help.qlik.com/en-US/sense/February2019/Subsystems/Hub/Content/Sense_Hub/ChartFunctions/define-aggregation-scope.htm
QlikView: https://help.qlik.com/en-US/qlikview/November2018/Subsystems/Client/Content/QV_QlikView/Examples%20of%20Aggregate%20Qualifiers.htm
Juraj
Hi Juraj,
I think I am missing something here. In your code the GetObjectField function is within $(= ), so to my mind this must be calculated outside of the chart? Given this, how does it know which chart to give the dimension for?
I’ve just tried it, with two tables with columns in different orders and =[$(=GetObjectField(0))] as an extra dimension replicated the first column of the table. As your blog suggests it would.
Everything I thought I knew about $(= ) means that this shouldn’t work. Does the scope work differently in Sense to QlikView?
Hi Steve,
thanks for stopping by. I’m not sure what you mean. I’ve used dollar-sign expansion in chart expressions and they always evaluated in the chart context. The help says that the expansion is done “just before the script statement or the expression is evaluated” (https://help.qlik.com/en-US/sense/September2019/Subsystems/Hub/Content/Sense_Hub/Scripting/dollar-sign-expansions.htm).
That is not to say that I did not bang my head against a wall on several occasions when trying to get the expansion work in the way I wanted it to. 🙂
Hi Juraj,
That is correct, I’ve had it confirmed by HIC in a different thread! In my head if you did $(= it behaved a bit like starting your variable code with an equals, but it doesn’t – it is aware of the object it is in. Not sure how it behaves in QlikView?
I suppose there are not many things which would be different in the context of an object rather than outside of it, prior to calculation, the dimensions used in columns is one such example though.
Thank you for sharing. Percentage contribution from an Alternative Measure – solved!
Cheers, Steve.
Love this solution!!
Thanks
Vikas