
You’ve most likely heard of the Telemetry Dashboard or NodeGraph. If you are not using them already, be sure to check them out, because they are excellent tools to help you with performance tuning (Telemetry Dashboard), and data lineage and documentation (NodeGraph). You are also most likely using Operations Monitor app provided with the QSE installation. It contains a great sheet usage analysis, which is a must-use source for life-cycle management of your Qlik Sense apps and sheets. If you use all of the tools I’ve just mentioned, then you’ve probably noticed already, that the sheet usage analysis in Operations Monitor is affected by the Telemetry Dashboard and NodeGraph. If you haven’t yet figured out how to fix it, then continue reading.
The Problem
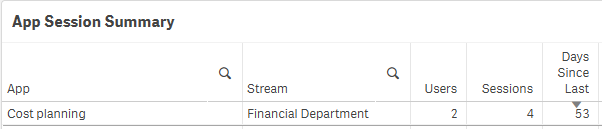
Let’s look at an example, because that’s really how I found out. Here’s an app which is not very popular, considering it did not have any sessions in past 53 days. This picture is taken from Operations Monitor, sheet Session Details:
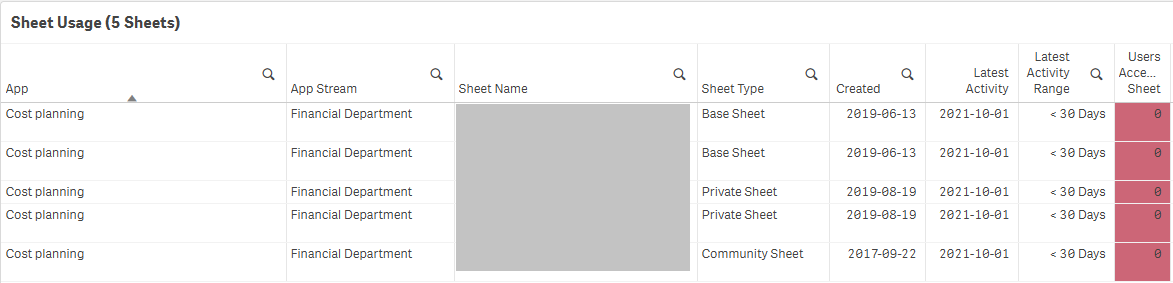
One would assume that when you have an app like this, you’d see many unused sheets in Sheet Usage sheet in Operations Monitor. And if you do not use Telemetry Dashboard nor NodeGraph, this assumption holds. But not in my case:

Zero unused sheets in past 30 days. Remember when was the last session? Yes, correct, 53 days ago. How so? Looking at Sheet Usage table I can see there’s pretty recent activity for all of those sheets:
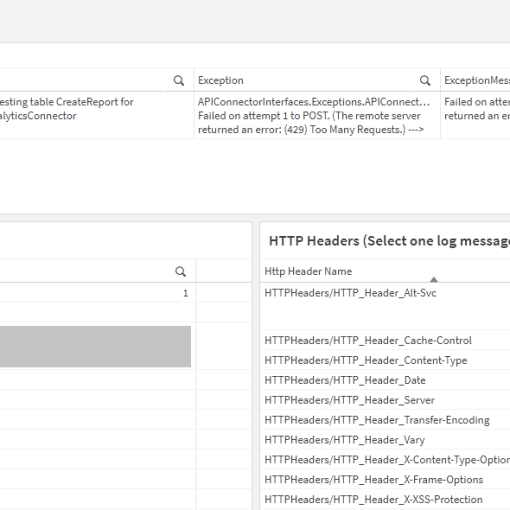
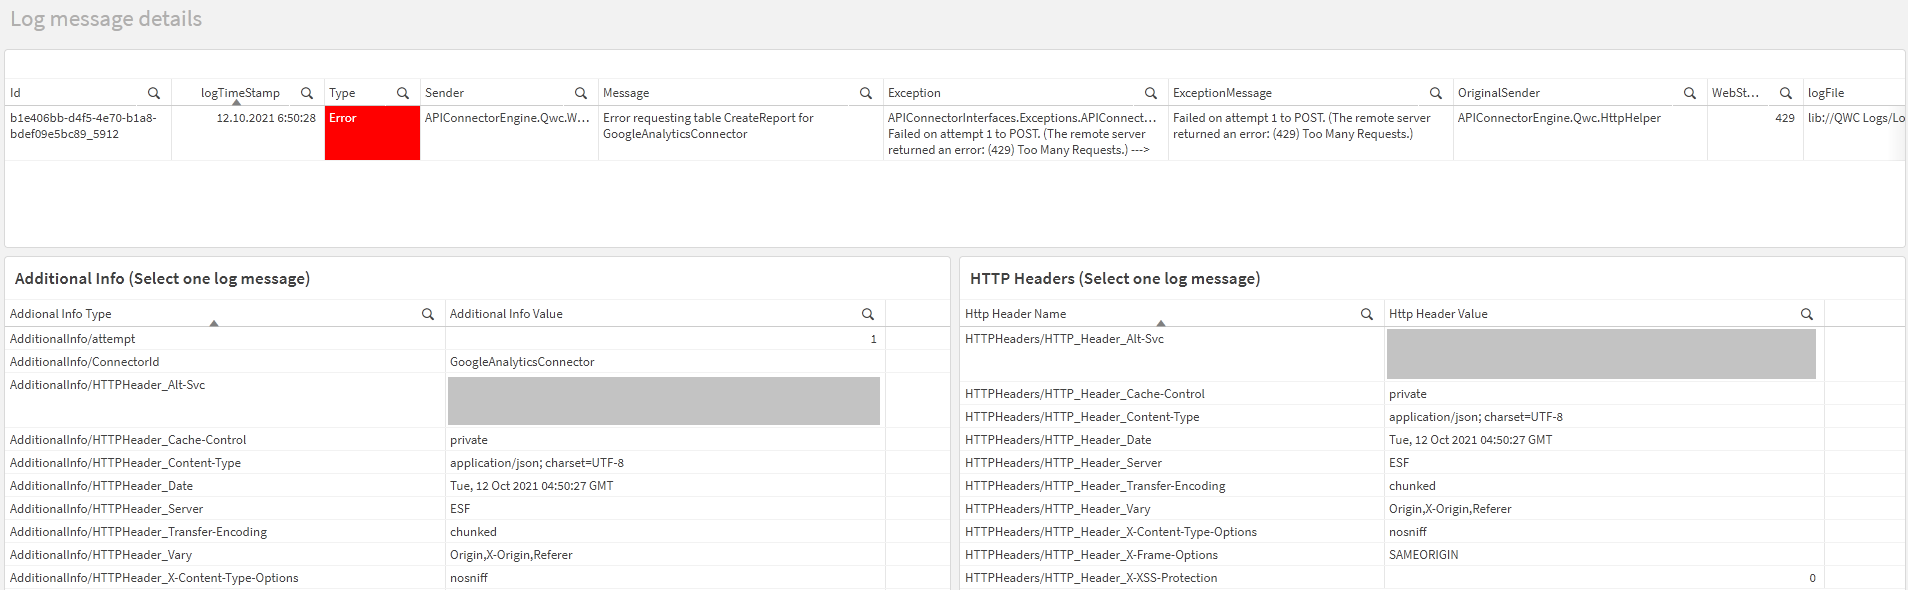
Moving on to Log Details tab, I can see there are quite a few log entries. I can safely ignore the first one, as it denotes reload and does not mean “usage”. But notice lines from October 1 (matching the latest activity date from the picture above):
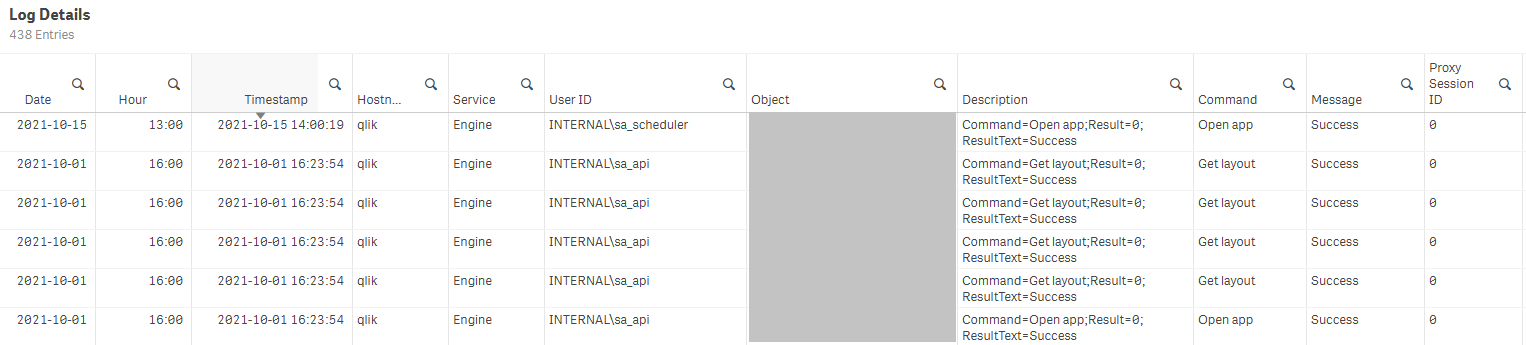
User INTERNAL\sa_api was looking at some app objects, although it did not have a valid session. Further investigation showed, that I did a reload of Telemetry Dashboard “generate metadata” task exactly at that time. So the culprit was quite clear. However, I also noticed similar activity for another user, INTERNAL\sa_reporting. This was pretty interesting, because this activity did not conincide with any task running on Qlik Sense. After quite some time I realized that it actually is NodeGraph grabbing app content in a similar way the Telemetry Dashboard does.
The Solution
How to sort this out then? We need to look at the load script of Operations Monitor app. In order to flag wheter an app sheet is used or not, Operations Monitor creates a flag called sheet_audit_indicator when loading Engine Audit Activity data:
(Lower(command)='get layout') * (Lower(Subfield(object_name,chr(124),-1))<>'not available') AS sheet_audit_indicatorThis basically says that if a user wants to get layout of an object and the object is a valid object, we can consider this as an “activity” or “usage”. This is what happens when you open an app, but this is also exactly what Telemetry Dashboard and NodeGraph are doing, although they do not have a valid session. So to fix this we either need to exclude these specific users (sa_api, sa_reporting), or all INTERNAL users. Or simply all activity which happens outside a session and does not have a valid session id. I made the following adjustment:
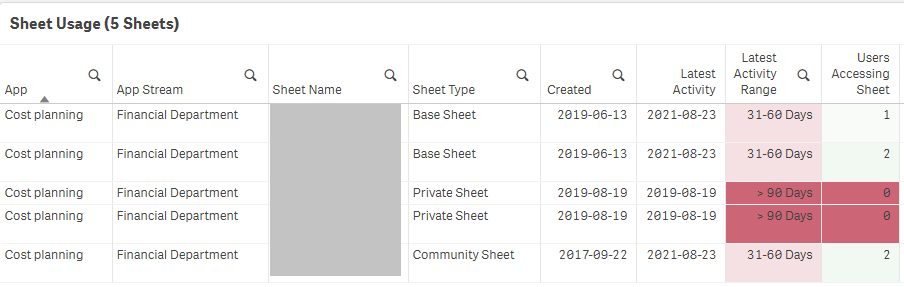
(Lower(command)='get layout') * (Lower(Subfield(object_name,chr(124),-1))<>'not available')*(ProxySessionId<>0)*-1 AS sheet_audit_indicatorAnd it works like a charm:
The exact location of the adjustments depends on whether you use database or file logs. If you use database logs, then look at load_database_logs script section. If you use file logs, then you need to look at defineFields script section and search for sheet_audit_indicator field. You’d also need to regenerate governanceLogContent qvd generated by the Operations Monitor, because the flag is stored there, therefore your historical data will not be fixed automatically.
There, your sheet usage analysis is fixed and you can start deleting all those sheet duplicates taking up valuable resources!