
Looking into QWC Logs
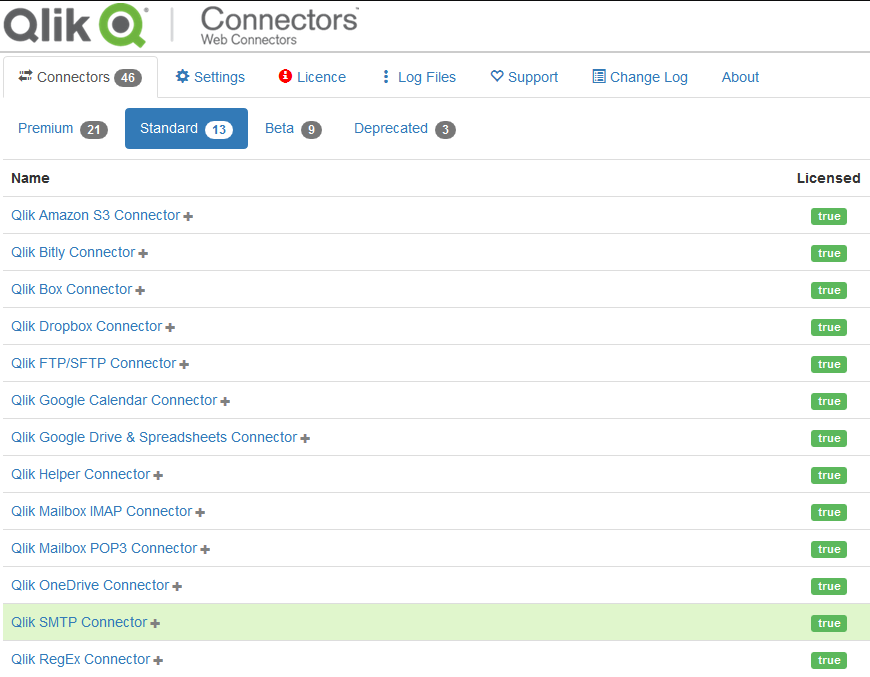
I recently faced an issue with a failing Qlik Sense task which was loading data from Google Analytics API via Qlik Web Connectors. The task was failing quite often and the script log was not very helpful. QWC just logged “Internal Server Erorr (500)” or some other very general error. So I opened QWC web console to look into QWC logs. Finding an error was a piece of cake. However, I wanted to know whether or not it is this exact error causing other failures as well.
Given the number of requests we do to various services via QWC, this was NOT that straightforward. Naturally I tried to load the log files. However, the log file itself is basically an invalid XML file (it does not have a root element). Moreover, the structure of the file varies depending on whether it contains an error or not (and which connector logged the error and what details were provided with the error, etc.).
Qlik Web Connectors Log Analyzer
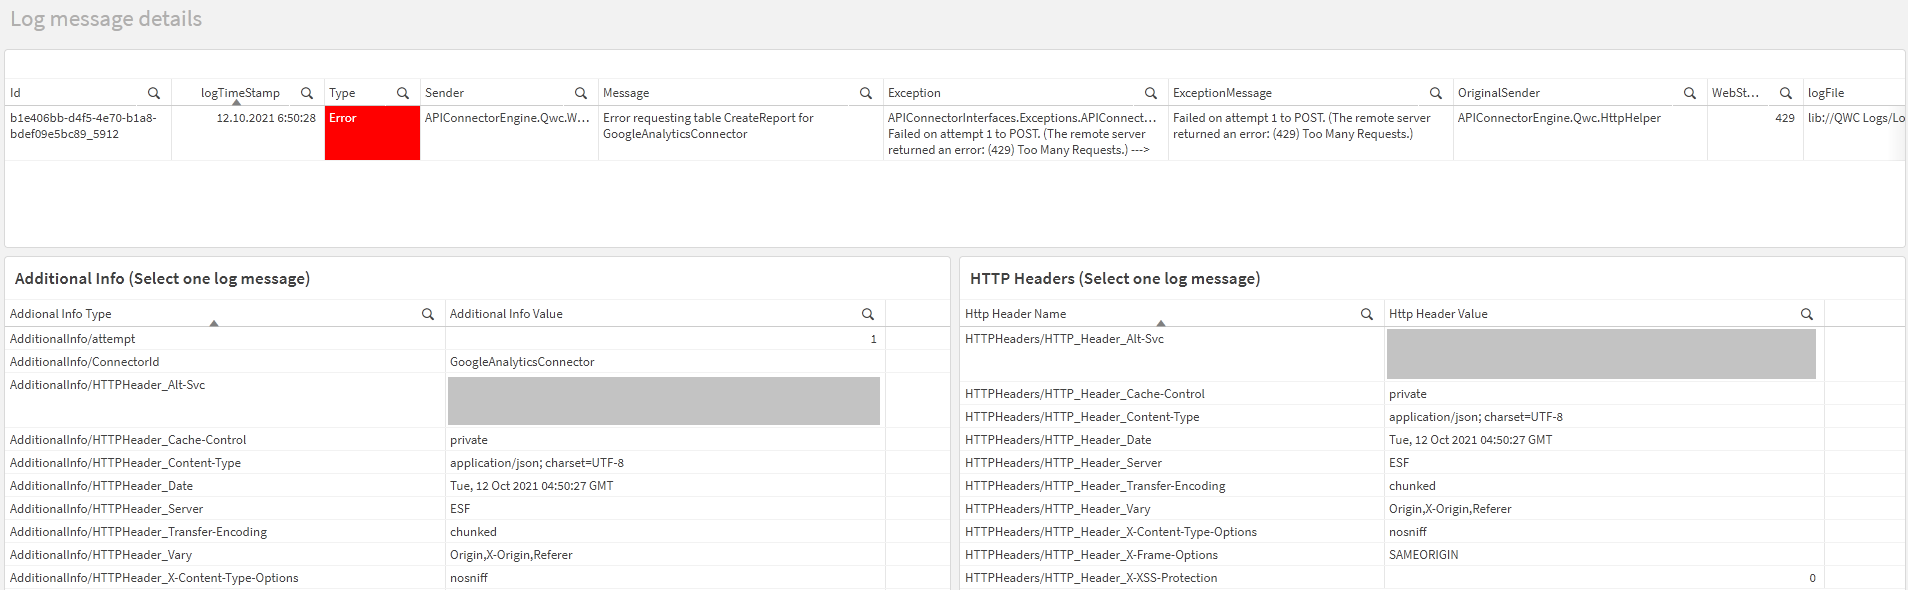
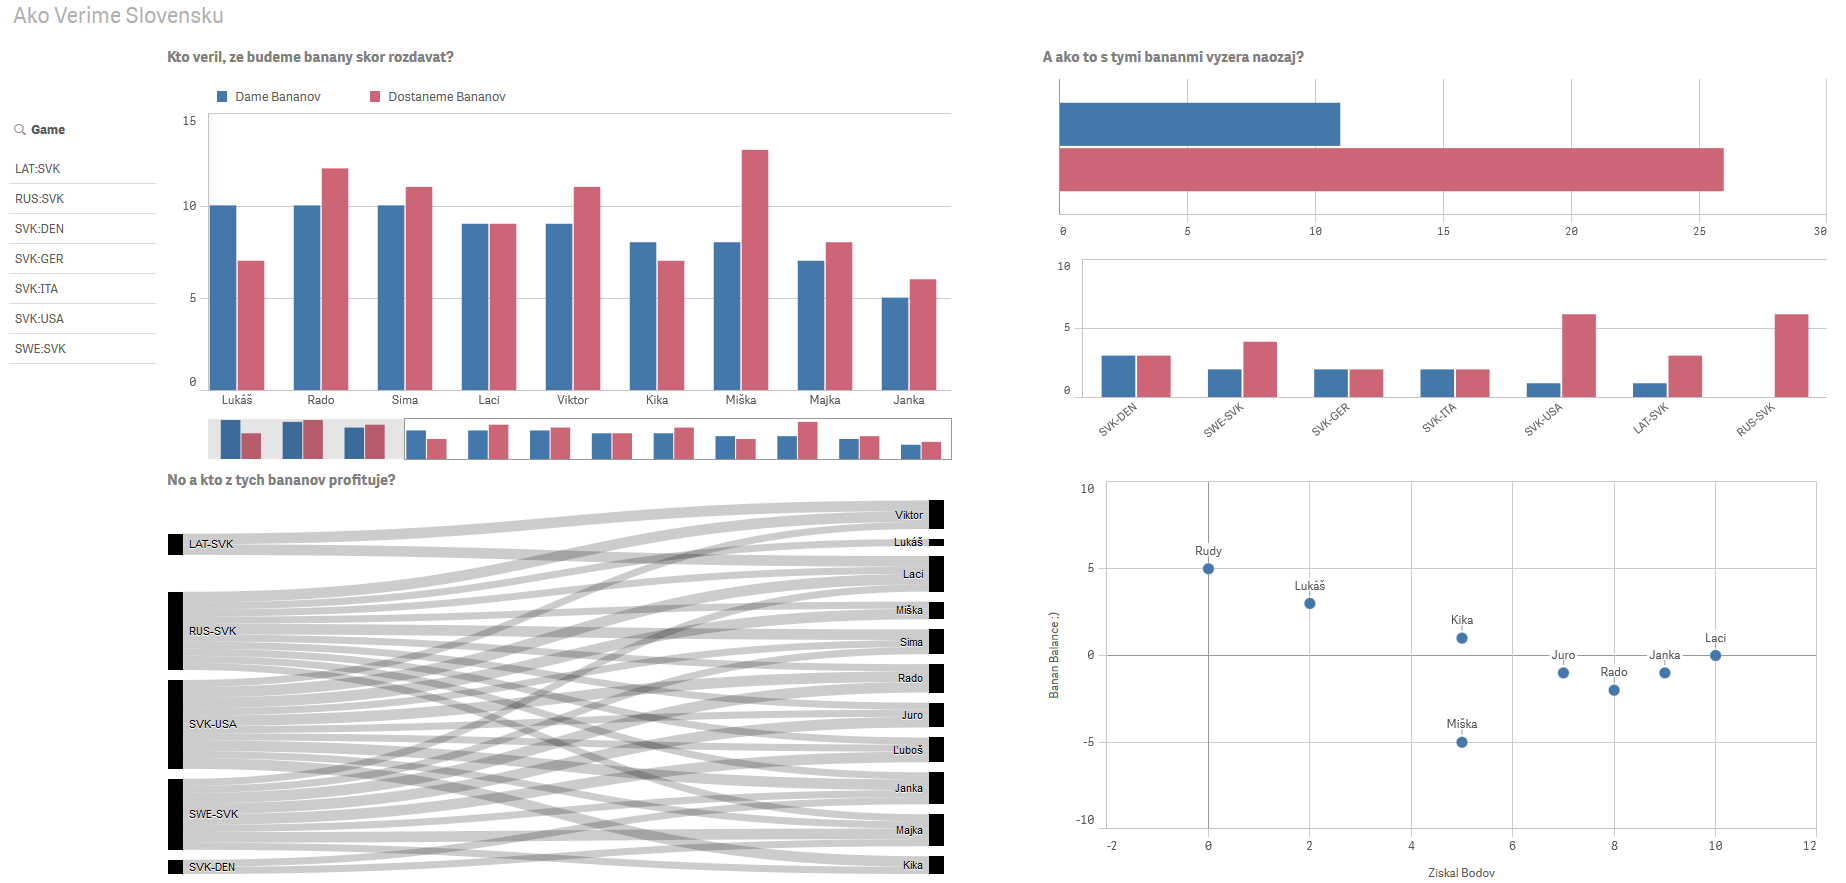
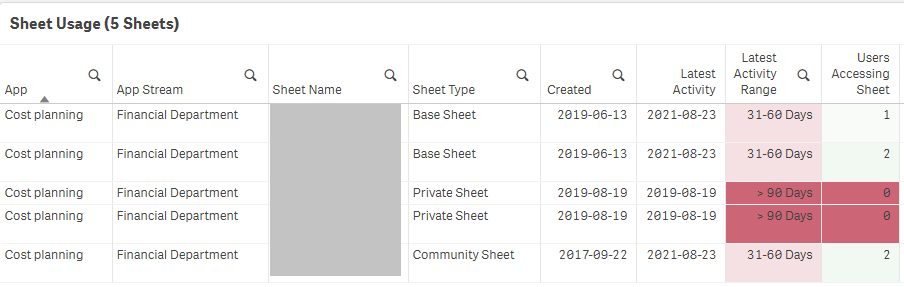
Long story short, there were a few issues I’ve face, but finally I’ve managed to build this Qlik Web Connectors Log Analyzer App. The app will help you to get an overview of QWC usage, but more importantly, it will also surface errors/responses returned by the web service or API which you are trying to get data from. You can see if a certain error is just one time thing, blurp, or a regular issue and needs to be fixed.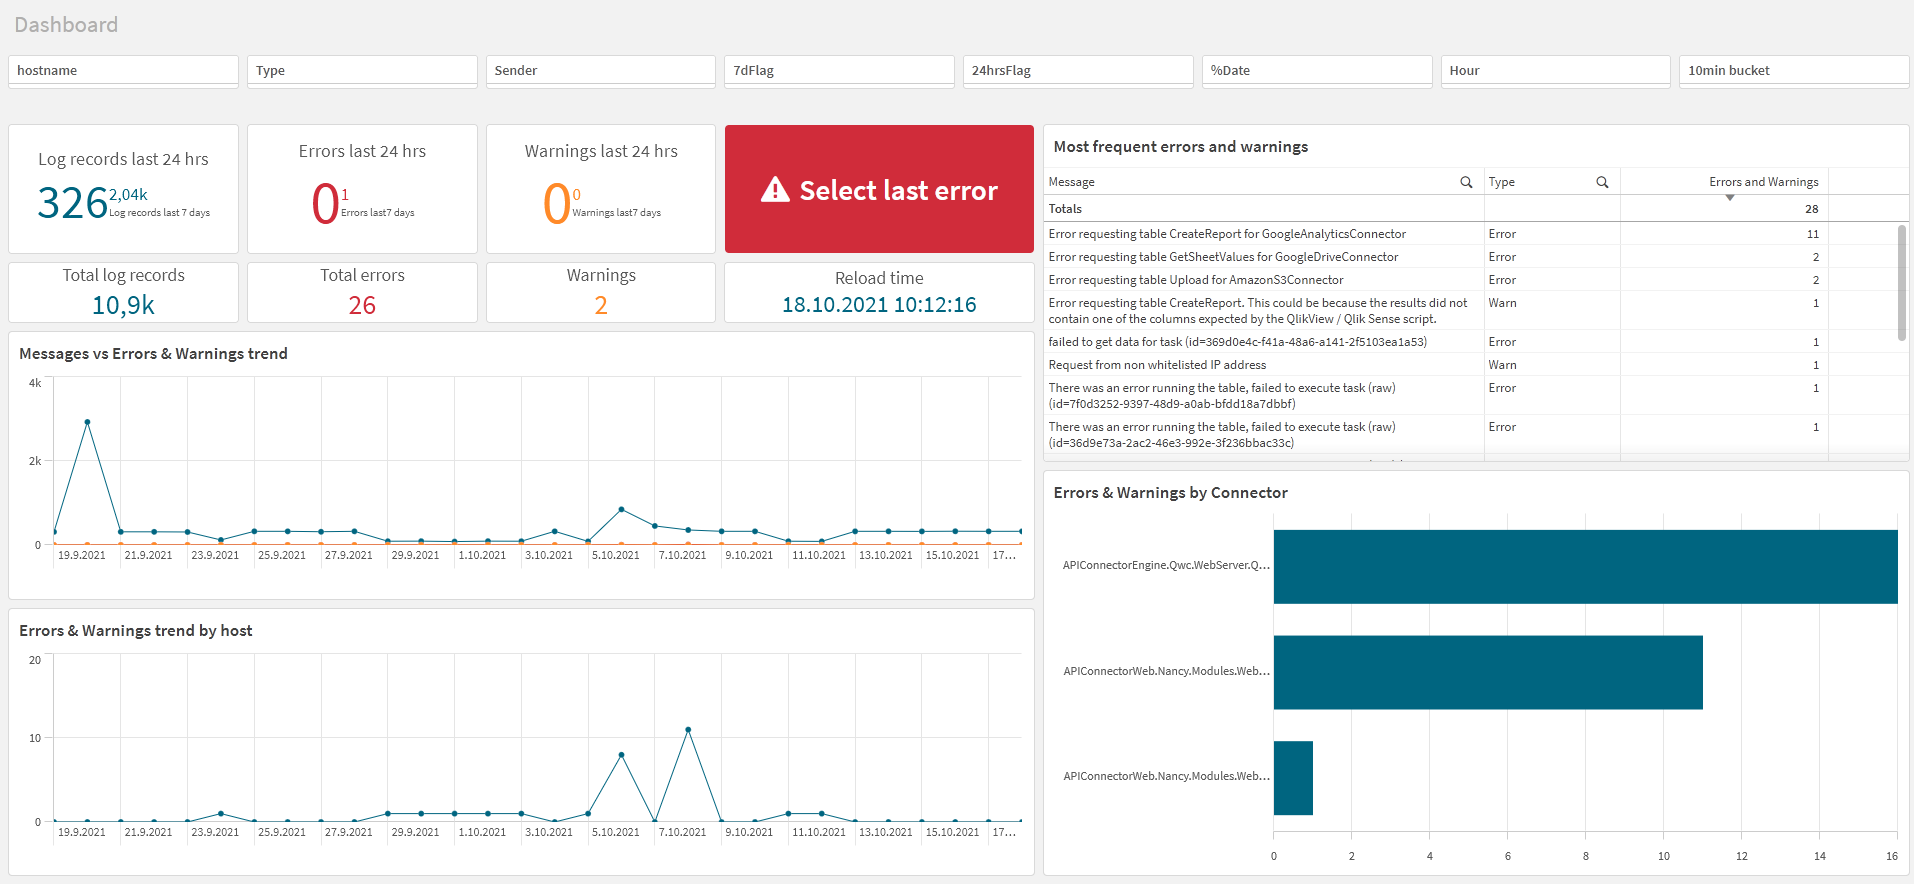
Installation and basic setup
To install and use the app simply download attached qvf and import it to your Qlik Sense environment. There are to configuration steps you need to complete in app script in order to run the app:
//how much history do we want
LET vKeepHistoryDays = 30;

//multinode config: list hosts with QWC installed and data connections to read data from these hosts
nodes:
LOAD * inline [
hostname, dataconnectionname
servername, data_connection_pointing_to_qwc_logs
];
Variable vKeepHistoryDays is pretty self-explanatory, fill in number of days of history you want to keep in the app (including today).
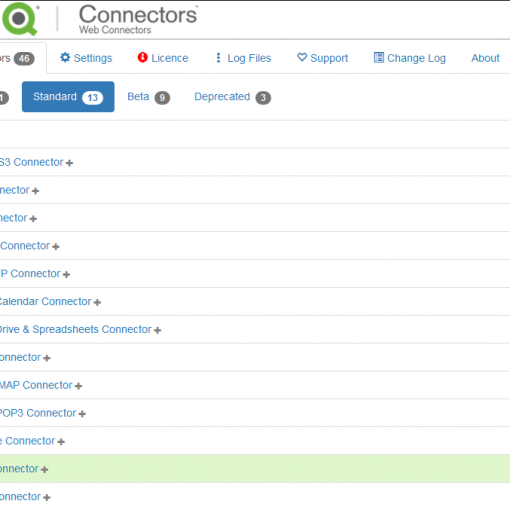
To complete the [nodes] table you first need to create a data connection to QWC log folder. The path will vary on your system, but it will be something like C:\QlikWebConnectors\App_Data\uuid_labeled_folder\Logs. You can have one or more [uuid_labeled_folder]s in the App_Data folder, so make sure to choose the right one (simply by looking into the logfiles). If you have serveral QWC installations on several servers, do this for all servers you want to monitor. Then complete the inline table by filling in (your chosen) hostname and data connection name.
The app will then generate necessary number of log file names for all hostnames and then simply loop through all those files and try to load them, accounting for all the hassles I mentioned at the beginning of this post. Just schedule a reload task and happy monitoring.
Oh, I almost forgot: download the QWC Log Monitor here. Feel free to leave any feedback or improvement ideas in the comments.
