
(Slovak: Slovenskú verziu tohto blogu nájdete tu: https://community.qlik.com/docs/DOC-19989)
Every year during IIHF Ice Hockey World Championship we organize a little betting competition in EMARK. Participants range from long term ice hockey fans to those who are barely able to name a few famous hockey players, and sometimes this kind of participant even wins the competition. The competition ends with a small refreshment prepared by the winner, which is one of the most important goals of the competition: to have fun over food and drinks. Next couple of posts will describe how you can set up such betting competition using Qlik Sense, Qlik Rest Connector and Google Sheets.
I will spare you going through the “history” part of this post, suffice to say I used MS Excel and emails to keep track of all the bets and results. Check the screenshot below and I’m sure you have quite clear idea about how time consuming it was. I needed to automate it.
Ingredients
I needed to automate three things: collection of bet inputs, automate bet processing and assignment of points, distribution of results to participants.
Google Sheets: To automate collection of bets from participants I set up a Google spreadsheet. Each participant has a dedicated sheet which is 1) linked to main results sheet to pull match data; 2) protected, so only a dedicated player can edit it. This means that I only need to maintain few sheets no matter how many players.
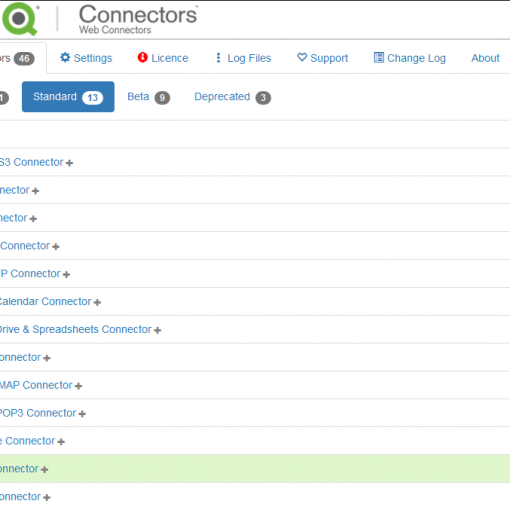
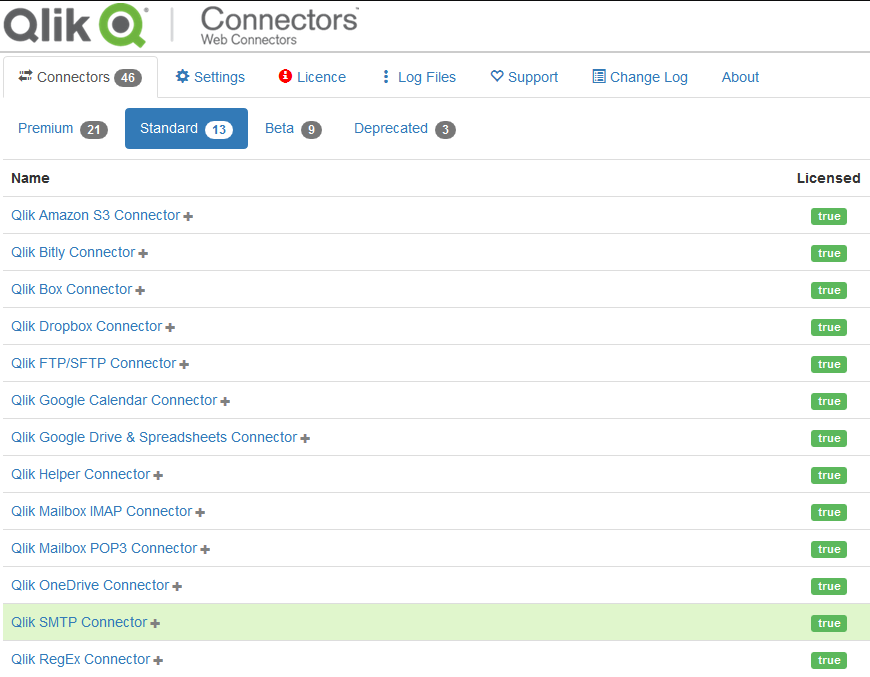
Qlik REST API Connector: To load data from Google Sheets to Qlik Sense I use the Qlik REST API Connector. I used Qlik Google Drive & Spreadsheet Connector from the Web Connectors package, but the fact that I needed to create separate connection for each load convinced me to switch to REST connector. Since February 2018 release of Qlik Sense you can change URLs of web file connections, so this is not a big deal anymore and you can perfectly do this using Web Connectors.
Qlik Sense Enterprise: A Qlik Sense app takes care of data load and points assignment. I set up the app with few simple visualizations and challenged participants to create new analysis.
Step 1: Collecting bets using Google Sheets
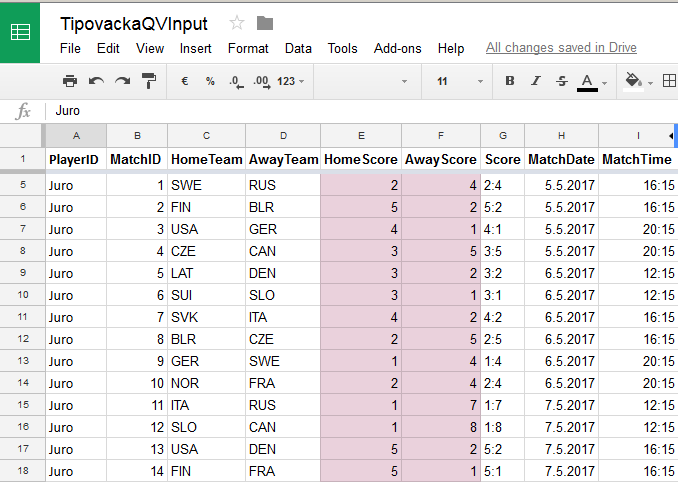
Managing user input is probably one of the most challenging tasks and while I tried hard to make it as straightforward as possible I still get questions about the process. I started by creating a list of all matches (teams, date & time, result) of the tournament. Then I created a sheet for user input and using formulas I linked match data (teams, date and time, but NOT the result) to the input sheet. Then I created a copy of this sheet for each competition participant. After sharing the file with participants I protected individual sheets so that only I (as an admin) and a dedicated participant could make changes. As a secret ingredient I added a plugin which tracks changes on each sheet, thus enabling me to only consider those bets which were placed before match start. I also added a sheet containing simple list of participants (so that I can track participation) and list of hockey teams (to track teams which dropped out and store link to flag image) and that’s it.
Step 2: Loading data using Qlik REST Connector
As already mentioned, in past I used Qlik Web Connectors to load the data from Google Sheets and you can perfectly do so. If you’d like to learn more, just let me know in comments and I can dedicate one of future posts to this topic.
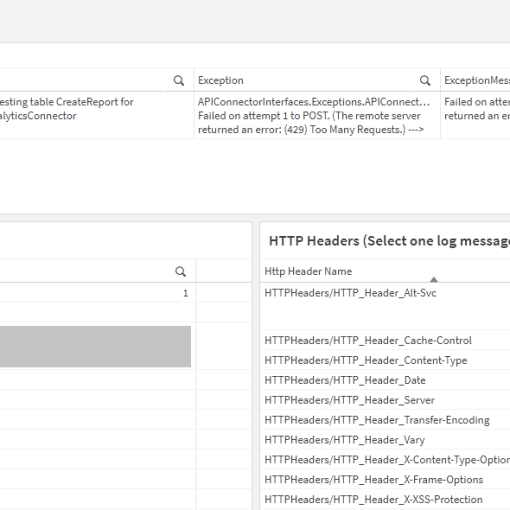
The reason I switched to REST Connector was its ability to change request URLs dynamically. However, I faced some trouble setting up authentication, because I did not want to go with “link sharing” the spreadsheet. You can read step by step guide how to authenticate your app against Google API here: https://community.qlik.com/thread/194023. But there’s one more step. REST Connector did not return data in tabular format, but in a long list of values, basically rows transposed and concatenated into a single long column. There’s a way around this and I posted an example script on Qlik Community earlier this year: https://community.qlik.com/docs/DOC-19640. This helped me to load match data, list of participants, and then bets for all participants in a single loop. After combining bets with actual match results I assign points and generate calendar table. A very (very, very) simple data model is ready.
Step 3: Sharing the results
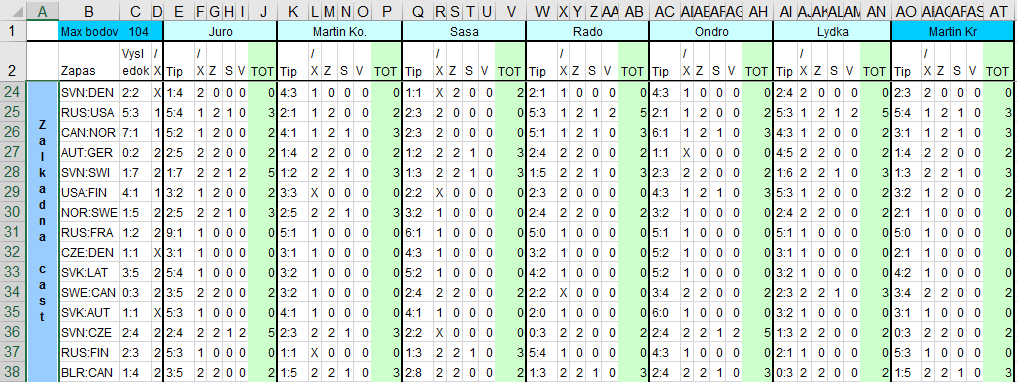
The first visualization I created was replica of the monstrous table which existed in the original excel file. Not very legible, although good for analyzing all details.
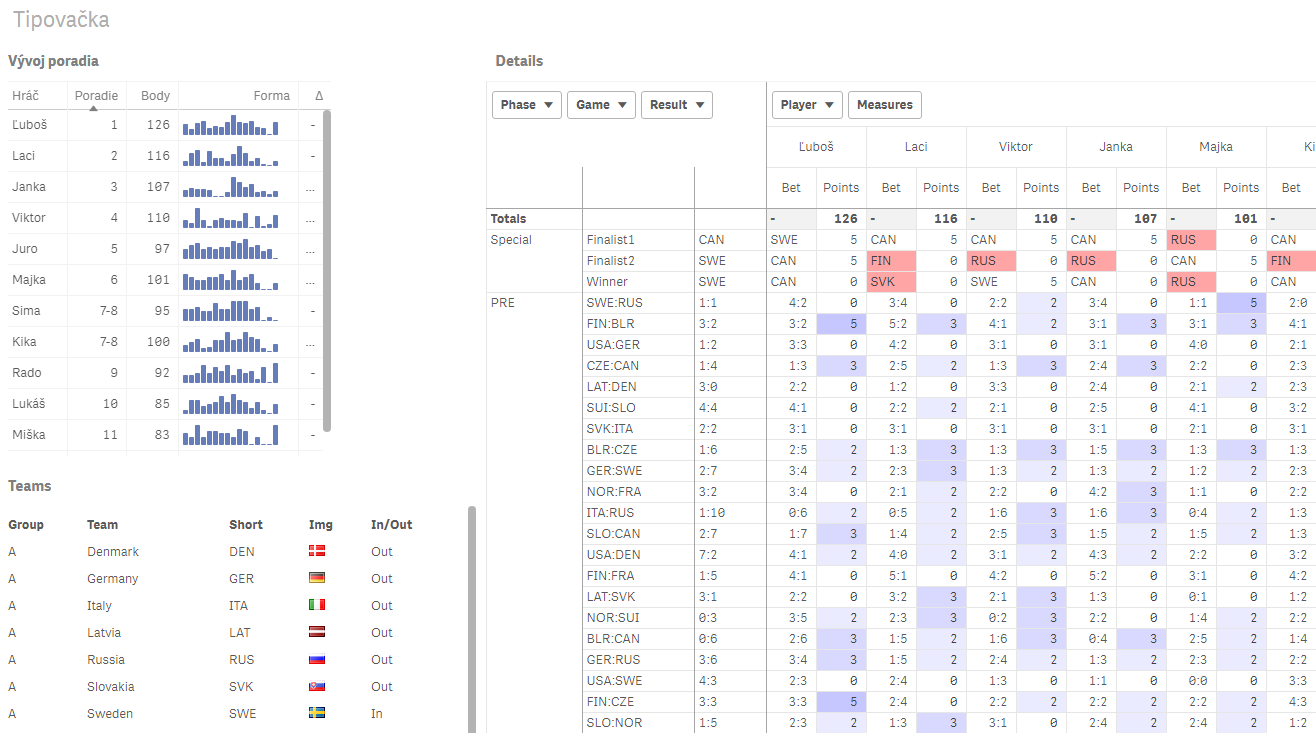
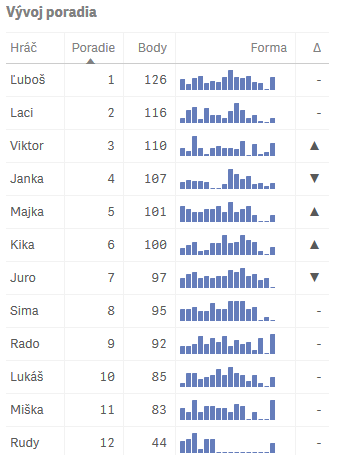
However, most of the participants were interested in current standings, for which I used the Vizlib Table extension, simply because it features minicharts and I was able to make it more meaty.
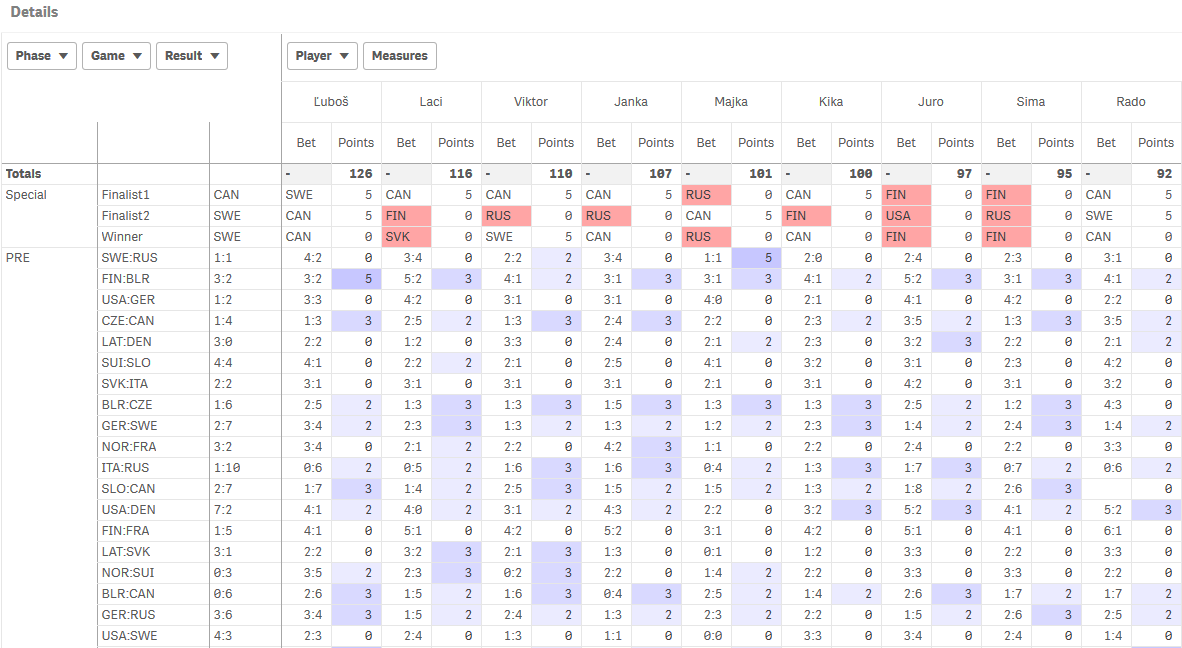
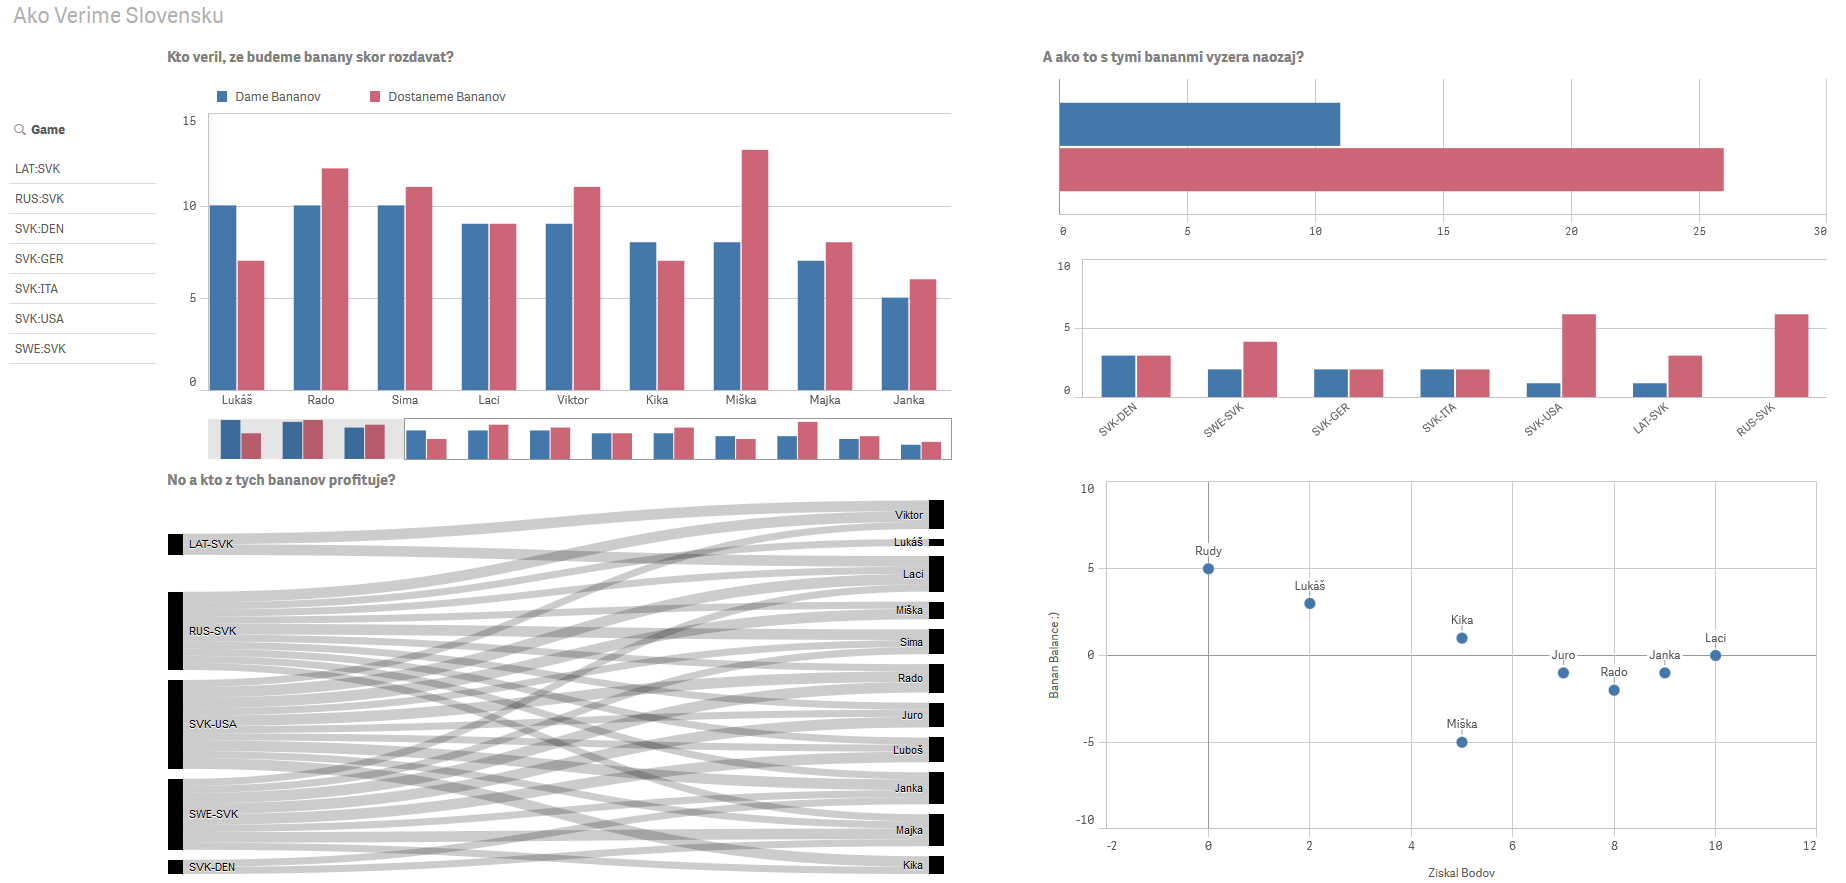
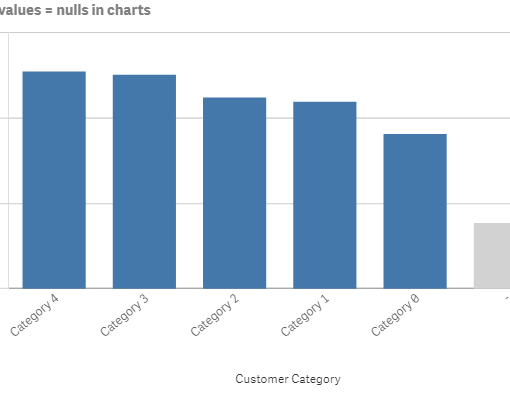
Finally, I added a couple of line charts showing points and ranking trend and that was it, the championship could begin. But, since I knew the app was very simple, I also challenged all participants to create their own visualizations and analysis, and they accepted the challenge. For example, picture below shows an analysis of how individual participants support our team (Go Slovakia!) and what that means for their points.
You can download example app here. There’s certainly a lot to improve in this app. The data model is very simple and is not fit for advanced analysis by teams (author of the above charts could tell you), one could add many more interesting visualizations, etc. But it still provides a good starting point and an opportunity to have fun with friends and colleagues. Any feedback is welcome!
2 thoughts on “How to Organize A Simple Betting Competition In Qlik Sense”
Thank you so much for providing such a unique piece of information about QlikSense, QlikView and REST API.
Hi James, thank you for dropping by and checking my site.